Notes on the 80/20 rule
If you have any knowledge of business you will most probably be familiar with the 80/20 rule. 80% of your sales derives from 20% of your customers, 80% of a companys profit is created by 20% of its employees, and so on and so forth. This rule of thumb is common business knowledge, and was originally devised by the Italian economist Vilfredo Pareto. It is also known as the Pareto principle.
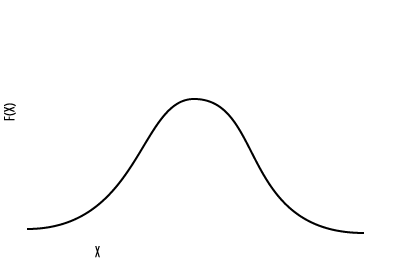
If you dig a little deeper you will find that most distributions in nature and business follow a normal distribution, along the known bell curve. Examples of this are the height of a population, the returns of an asset portfolio, and the velocity of molecules in a gas. A lot of average stuff, and a few anomalies at the high and low end. You have most probably seen this curve countless times.

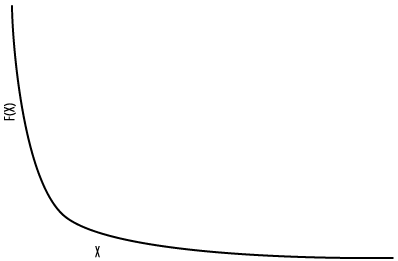
Distributions following the pareto principle however, have a completely different distribution, known as a powerlaw. (Didn't know mathematicians could think up such cool names!!!) The distribution of a powerlaw is depicted in the graph below.

What you will find (and a lot of mathematicians have) is that all 80/20 rules follow a powerlaw as the one in the graph. If for instance you have the sales in $ to a customer along the X axis, and the number of customers along the Y axis you will get a powerlaw graph, showing that a lot of customers buy little, and few customers buy a lot
In the real world the graph will not always have the same curve, but will always follow the strict mathematical formula. You can for example experience 70/30 rules, or 85/15 rules, meaning that the "bend" of the curve is slightly different.
This is interesting, seen from a busines perspective, bcause it makes it possible to predict with a certain level of confidence which customers you should really look out for, which employees you should do everything to keep, etc. The "tail" of the curve is the one to watch, as this is usually where the real ation is. If you can locate common traits in the subjects in the tail you might be able to save a lot of money and effort, or enhance your sales substantially.
The powerlaw distribution also applies to networks. You have a certain number of nodes and each node has a certain number of links to other nodes. If you plot the number of links along the X axis, and the number of nodes having x connections along the Y axis you will also get the ultracool powerlaw distribution. This can for example be seen on the world wide web, where a very small amount of webpages (nodes) have thousands of hyperlinks (links) pointing to them, and a very large number of webpages have few or no links pointing to them. The Yahoo's and Google's are at the tip of the tail with millions of links. Likewise with social networks: A few people (nodes) have ahelluva lot of friends and acquaintances (links), whereas most people hang around the same old crowd. Once again, the tail is where it all happens: If you get the tail the rest will follow, this is where the connected, cool, allknowing, and opinion leading nodes are. Some call them opinion leaders, Seth Godin calls them sneezers, I call them connected.
So watch the tail....
If you dig a little deeper you will find that most distributions in nature and business follow a normal distribution, along the known bell curve. Examples of this are the height of a population, the returns of an asset portfolio, and the velocity of molecules in a gas. A lot of average stuff, and a few anomalies at the high and low end. You have most probably seen this curve countless times.

Distributions following the pareto principle however, have a completely different distribution, known as a powerlaw. (Didn't know mathematicians could think up such cool names!!!) The distribution of a powerlaw is depicted in the graph below.

What you will find (and a lot of mathematicians have) is that all 80/20 rules follow a powerlaw as the one in the graph. If for instance you have the sales in $ to a customer along the X axis, and the number of customers along the Y axis you will get a powerlaw graph, showing that a lot of customers buy little, and few customers buy a lot
In the real world the graph will not always have the same curve, but will always follow the strict mathematical formula. You can for example experience 70/30 rules, or 85/15 rules, meaning that the "bend" of the curve is slightly different.
This is interesting, seen from a busines perspective, bcause it makes it possible to predict with a certain level of confidence which customers you should really look out for, which employees you should do everything to keep, etc. The "tail" of the curve is the one to watch, as this is usually where the real ation is. If you can locate common traits in the subjects in the tail you might be able to save a lot of money and effort, or enhance your sales substantially.
The powerlaw distribution also applies to networks. You have a certain number of nodes and each node has a certain number of links to other nodes. If you plot the number of links along the X axis, and the number of nodes having x connections along the Y axis you will also get the ultracool powerlaw distribution. This can for example be seen on the world wide web, where a very small amount of webpages (nodes) have thousands of hyperlinks (links) pointing to them, and a very large number of webpages have few or no links pointing to them. The Yahoo's and Google's are at the tip of the tail with millions of links. Likewise with social networks: A few people (nodes) have a
So watch the tail....


0 Comments:
Post a Comment
<< Home